

Understanding Errors: Reading Stack Traces & Logs
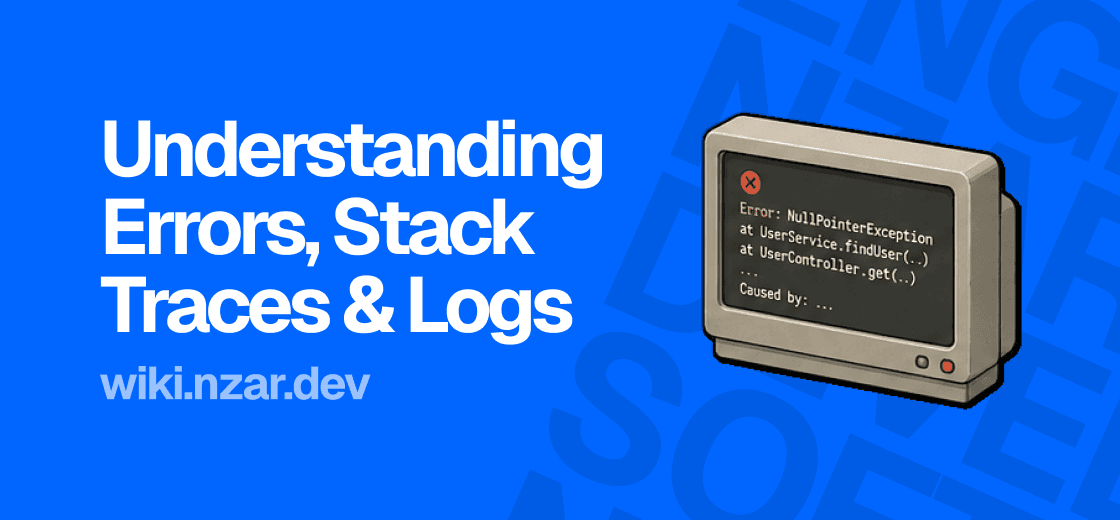
Your code runs, and instead of the result you expected, your screen fills with red text. Some unfamiliar word, a pile of file paths, a wall of lines you didn't write yourself. Your first instinct is probably to feel like something just broke badly.
Take a breath. That wall of red text isn't your enemy. It's actually one of the most helpful things your computer will ever say to you, it's just written in a language nobody sits you down and teaches. This article is that lesson.
An Error Is a Message, Not an Attack
Here's the mindset shift that changes everything: an error message is your program trying to help you. Somewhere, something didn't go the way your code assumed it would, and instead of silently doing the wrong thing, the program stopped and told you exactly where and why.
Compare that to the alternative. Imagine your code just quietly kept running with bad data, giving a customer the wrong price, or saving a file to the wrong place, without ever telling you anything went wrong. That would be far worse. An error is your program raising its hand and saying "something's off, and here's exactly where I noticed it." It's on your side.
The Three Parts of Almost Every Error
Once you know what you're looking at, most error messages break down into the same three parts, in roughly this order.
The error type, a short label like TypeError or ReferenceError, telling you the general category of what went wrong. The error message, a specific sentence describing the actual problem, like "cannot read property 'name' of undefined." And the stack trace, a list of file names and line numbers, showing you exactly where in your code this happened, and how the program got there.
Most people's eyes glaze over and skip straight to Googling the error type. Slow down instead. The message usually tells you almost everything you need, and the stack trace tells you exactly where to look.
What a Stack Trace Actually Is
Remember the call stack from a program's execution, the list of function calls a program is currently in the middle of. A stack trace is a snapshot of exactly that, frozen at the moment something went wrong.
Think of it like a trail of breadcrumbs. Your code called function A, which called function B, which called function C, and it was inside C that things actually broke. The stack trace lists all of that, usually starting from where the error actually happened, and working backward through every function call that led there.
This is genuinely one of the most useful debugging tools you have, because it doesn't just tell you something broke. It tells you the entire path your code took to get to the exact spot where it broke.
Reading One For Real
Let's look at an actual stack trace and take it apart piece by piece.
Before you understand it, it just looks like this, an intimidating wall:
TypeError: Cannot read properties of undefined (reading 'name')
    at getUserName (app.js:14:22)
    at printGreeting (app.js:8:19)
    at main (app.js:3:3)
Scary, unfamiliar, easy to want to just paste into a search bar and hope for the best.
After you know how to read it, the exact same text tells a clear story:
The error: something undefined doesn't have a "name" property.
It happened inside getUserName, on line 14.
getUserName was called by printGreeting, on line 8.
printGreeting was called by main, on line 3.
Read top to bottom: type of problem, then exactly where it happened, then how the program got there. The top line of a stack trace is almost always where your actual bug lives. The lines below it are just the trail showing how you arrived there. In this example, something being passed into getUserName wasn't a proper user object, that's the real thread to pull.
Logs: The Story Your Program Tells While Running
Errors are what your program shouts when something breaks. Logs are what your program says quietly the whole time, even when nothing's wrong, little notes left behind about what it was doing and when.
The simplest form of this is something you've probably already used, console.log, printing a value out just to see what it actually is at that point in your code. That's a log. At a larger scale, real applications write logs constantly: a user logged in, a payment was processed, a request took longer than expected. Logs are usually tagged with a level, like info for normal activity, warn for something suspicious but not broken, and error for something that actually failed.
Why bother with levels at all? Because a running application generates an enormous amount of activity, and without levels, you'd have no way to filter out the routine noise from the handful of lines that actually need your attention. Structured, production-grade logging, and how to search through mountains of it efficiently, gets its own proper treatment later, in the Monitoring & Observability chapter. For now, just know that logs are the same idea as an error message, a note your program leaves for you, just written proactively instead of only when something breaks.
Not All Errors Are the Same Kind
It helps to know that errors generally fall into a few different buckets, because each one points you somewhere different.
A syntax error means your code isn't even valid in the language you're writing, a missing bracket, a typo in a keyword. These usually get caught before your program even runs. A runtime error means your code was valid, and started running fine, but hit something it couldn't handle partway through, like trying to read a property off something that doesn't exist. A logic error is the sneakiest of the three: no error message at all, your code runs successfully, and just quietly produces the wrong result. That last one is exactly why reading error messages well is only half the skill, the other half, actually hunting down a problem with no error message in sight, is what the next article is all about.
Why This Matters
Once you can actually read an error instead of flinching at it, debugging stops being a guessing game. You'll stop pasting entire stack traces into a search bar out of panic, and start reading the top line, checking the exact file and line number it points to, and going straight there.
This also changes how you feel about errors showing up at all. A red wall of text isn't a sign you failed, it's your program handing you a map straight to the problem. The engineers who look calm while debugging aren't calm because they don't get errors. They're calm because they know exactly how to read what the error is already telling them.